|
<<<,Home page
<<<Website Contents
1 | 2 | 3|
4 | 5 | 6|
7 |8 | 9|
10 |11| 12
13| 14 | 15
16 | 17 | 18
19 | 20 | 21
22 | 23 | 24
25 | 26 | 27
28 | 29 | 30
31 | 32 | 33
34 | 35 | 36
37 | 38 |39|
40 | 41 | 42
43 | 44 | 45
46 | 47 | 48
49 | 50 | 51
52 | 53 | 54
|
Theme: THE DEGRADATION OF WETLANDS AND ITS SOCIO ECONOMIC AND ENVIRONMENTAL IMPLICATIONS IN NDOP CENTRAL SUBDIVISION, NORTH WEST PROVINCE CAMEROON
Page 59
1995/96 |
5,715 |
1,704 |
0.30 |
4,260 |
1,211 |
83.0 |
100,513,000 |
1996/97 |
5,617 |
1,744 |
0.31 |
4,360 |
0,578 |
84.0 |
48,552,000 |
1997/98 |
5,594 |
1,760 |
0.30 |
4,402 |
0,498 |
80.0 |
39,866,640 |
1998/1999 |
6,741 |
2,009 |
0.30 |
6,966 |
0,584 |
80.0 |
46,727,120 |
1999/2000 |
7,026 |
2,225 |
0.32 |
7,787 |
0,139 |
80.0 |
11,131,840 |
2000/2001 |
2,195 |
1,740 |
0.35 |
6,091 |
1,194 |
80.0 |
95,520,000 |
2001/2002 |
6,930 |
3,045 |
0.44 |
7,613 |
1,515 |
90.0 |
136,350,000 |
2002/2003 |
7,689 |
2,076 |
0.27 |
8,304 |
0,505 |
90.0 |
45,450,000 |
2003/2004 |
7,474 |
1,877 |
0.25 |
7,508 |
- |
- |
- |
2004/2005 |
6,731 |
1,531.12 |
0.22 |
5,575.48 |
- |
- |
- |
Source: UNVDA (2005)
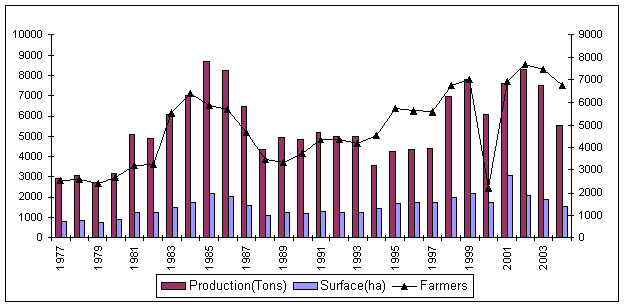
The table can be visually appreciated on figure 13. The figure takes consideration of the variables of production, surfaces cultivated in hectares and number of farmers involved from 1977 to 2004.
Figure 12: Evolution in rice production, surface areas cultivated and number of farmers involved. Source: Table 16, UNVDA 2005
From table 17 and figure 12, it can be seen that the U.N.V.D.A. heavily transformed the wetlands of the Ndop flood plain. By 1977, a surface area of 824 hectares had already been transformed with about 2500 rice farmer’s involved in the activity. By the year 2002, the U.N.V.D.A. developed over 3045 hectares, which is the highest area so far developed within this period. In 2004/2005, which virtually reflects the present situation, the U.N.V.D.A. transformed over 1.531.12 hectares, involving over 6731 farmers. The area of rice fields developed reveals a net increase. It can be understood that the number of farmers are increasing on surfaces which are decreasing and this is leading to pressure on these wetlands. However, this not exactly the case, if consideration is taken over the fact that even when the U.N.V.D.A. does not develop certain wetlands within a year, local farmers do the job. Each
55 | 56 | 57 | 58 | 59 | 60| 61 | 62 | 63| 64 | 65 | 66| 67 | 68 | 69 | 70 | 71 |72 |73 | 74 | 75
76 | 77 | 78 | 79 | 80 | 81 | 82 | 83 | 84 | 85 | 86 |87 | 88 | 89 | 90 |91 | 92 | 93 | 94 | 95
<<<Back to table of contents || Go to next page>>>
|
