Click to view each page as numbered

1 | 2 | 3|

4 | 5 | 6|

7 |8 | 9|

10 |11| 12

13| 14 | 15

16 | 17 | 18

19 | 20 | 21

22 | 23 | 24

25 | 26 | 27

28 | 29 | 30

31 | 32 | 33

34 | 35 | 36

37 | 38 |39|

40 | 41 | 42

43 | 44 | 45

46 | 47 | 48

49 | 50 | 51

52 | 53 | 54


Theme: THE DEGRADATION OF WETLANDS AND ITS SOCIO ECONOMIC AND ENVIRONMENTAL IMPLICATIONS IN NDOP CENTRAL SUBDIVISION, NORTH WEST PROVINCE CAMEROON

Page 23

The image was imported into the same Geographic Information system software (MapInfo 7.0) and analyses were made on the different land covers (see figure 2).
            G.P.S points relative to different land uses that were obtained on the field were used to assure results of the corresponding objects determined on the field and matched with the satellite image.  The images were then superimposed to understand the level of encroachment of one land use over the other.
            Also, treatments were made through the delimitation of broad land use categories into subgroups whose surfaces were calculated. These subgroups for example could be rice fields, zones of habitation, roads, and hill slopes. For this section of fieldwork, a transect of  1.217km by  18.47 km;  stretching from Bamunka through Bamali to Bambalang was studied closely through observations; in order to better appreciate the level of  degradation from one village to another.
            Concerning factors that account for wetland loss and degradation some were deduced directly from the previously explained treatments. Others which relate to the biodiversity were obtained from questions addressed in the second questionnaire.

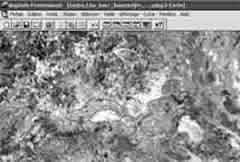
Figure 2: Satellite image imported and treated using MapInfo 7.5

55 | 56 | 57 | 58 | 59 | 60| 61 | 62 | 63| 64 | 65 | 66| 67 | 68 | 69 | 70 | 71 |72 |73 | 74 | 75


76 | 77 | 78 | 79 | 80 | 81 | 82 | 83 | 84 | 85 | 86 |87 | 88 | 89 | 90 |91 | 92 | 93 | 94 | 95

<<<Back to table of contents || Go to next page>>>

Back to home page| Content page | contact us at |